


 93 / 196

91
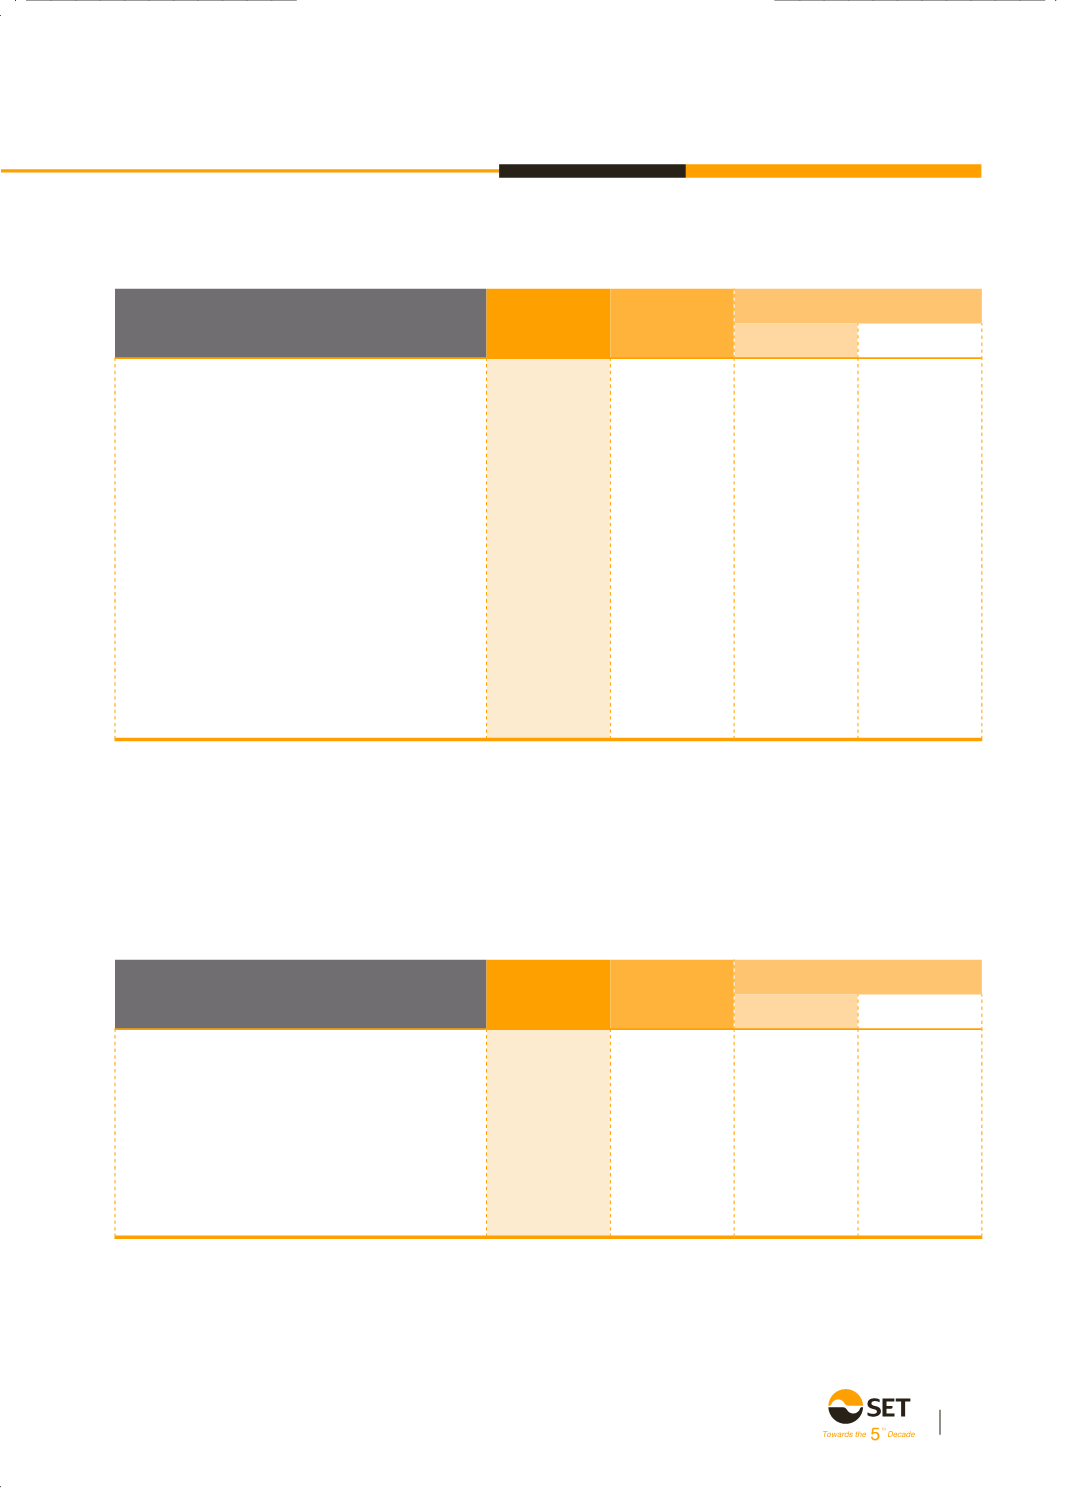
1.1.1 Securities Market
(Unit: THB million)
2015
2014
Increase /(Decrease)
Amount
%
Revenue - Securities Market
2,184
2,140
44
2.06
Trading fees
1,077
1,114
(37)
(3.32)
Clearing and settlement fees
293
300
(7)
(2.33)
Listing fees
494
435
59
13.56
Depository fees
283
260
23
14.38
Membership fees
37
31
6
19.35
Key market indicators
SET Index (point)
1,288
1,498
(210)
(14.02)
Daily average trading value - Equity (THB million)
44,302
45,466
(1,164)
(2.56)
Average market capitalization (THB trillion)
14.04
13.50
0.54
4.00
No. of listed securities (securities)
1,812
1,742
70
4.02
(Unit: THB million)
2015
2014
Increase /(Decrease)
Amount
%
Revenue - Derivatives Market
472
380
92
24.21
Trading fees
295
230
65
28.26
Clearing fees
127
99
28
28.28
Membership fees
50
51
(1)
(1.96)
Key market indicators
Daily average trading volume - Derivatives (contracts)*
199,749
169,363
30,386
19.74
Operating revenue from securities market rose by THB 44 million, or 2.06%, compared to 2014. This resulted from the
rise in listing fees as the number of listed securities rose. In addition, depository fees increased according to the increased in
average market capitalization. On the other hand, trading as well as clearing and settlement fees decreased because daily aveage
trading value decreased.
1.1.2 Derivatives Market
Operating revenue from derivatives market rose by THB 92 million, or 24.21%, compared to 2014, resulting from the rise
in daily average trading volume of derivatives, especially from SET50 Index Futures, which increased to an average of 110,842
contracts per day in 2015 (from 81,129* contracts per day in 2014).
* For comparison purpose, rebased of SET50 Index Futures to mini SET50 Index Futures (a multiplier was reduced from THB 1,000 to THB 200 Baht
since May 6, 2014)