


 96 / 196

94
Annual Report
2015
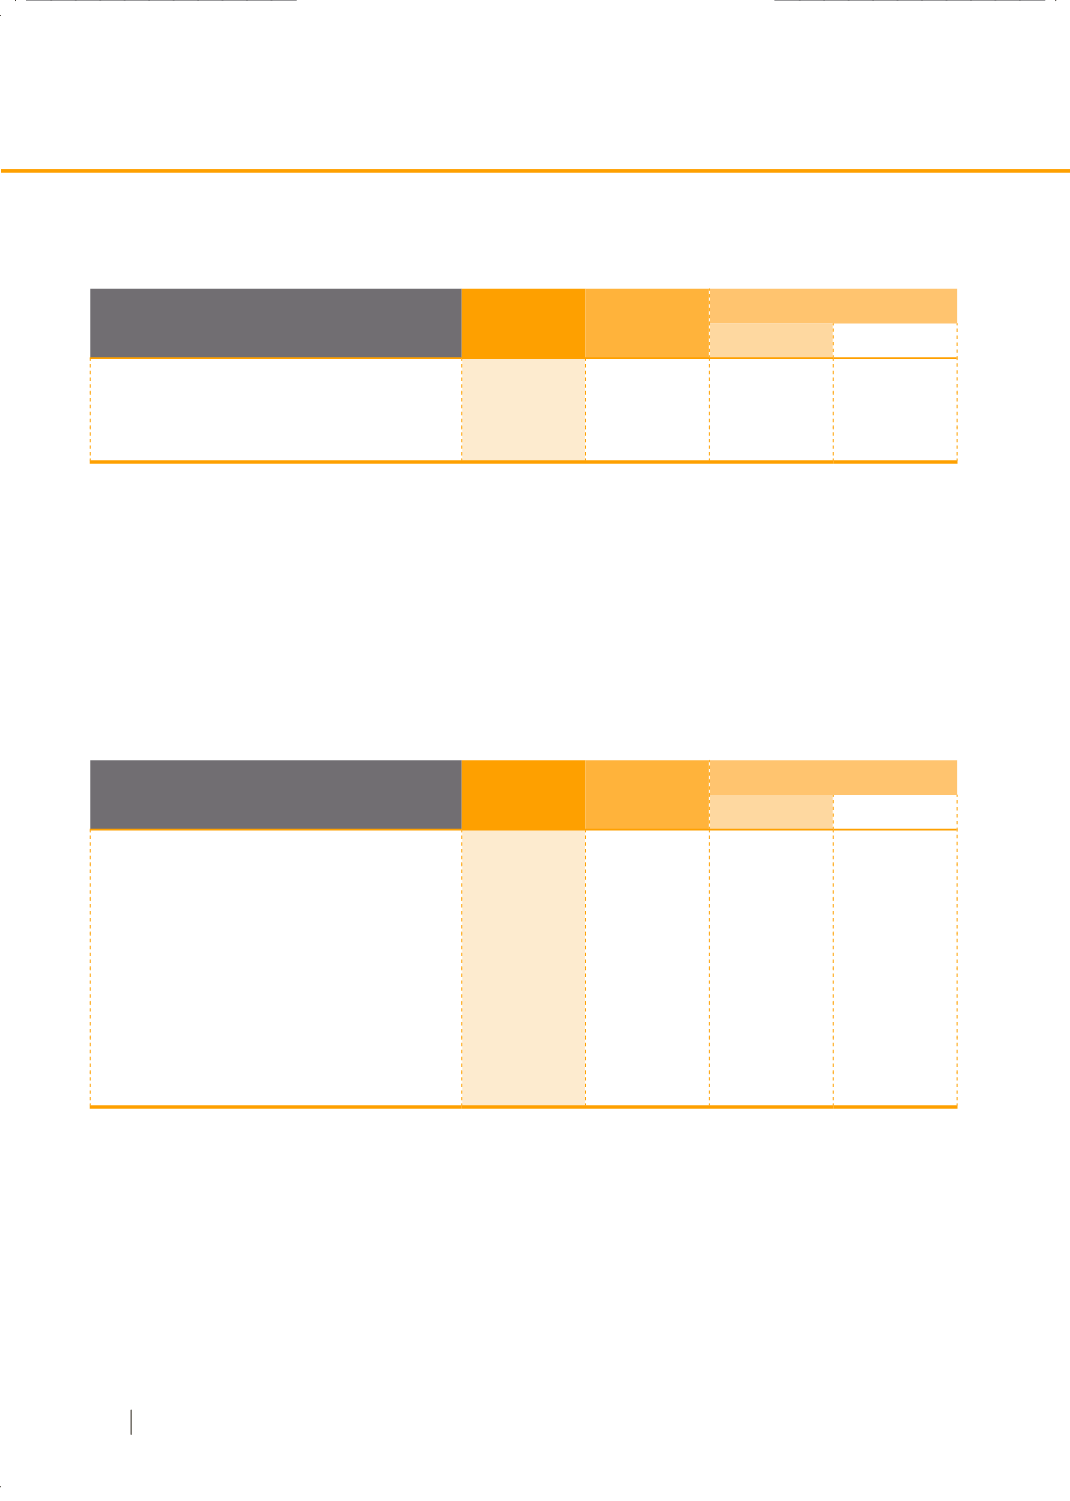
(Unit: THB million)
DEC 31, 2015 DEC 31, 2014
Increase /(Decrease)
Amount
%
Total assets
36,136
34,452
1,684
4.89
Total liabilities
12,747
12,213
534
4.37
Fund balances
23,389
22,239
1,150
5.17
(Unit: THB million)
DEC 31, 2015 DEC 31, 2014
Increase /(Decrease)
Amount
%
Cash and cash equivalents
1,661
1,361
300
22.04
Cash at banks for financial benefits payable
62
58
4
6.90
Investment portfolio
15,349
16,528
(1,179)
(7.13)
Trading
2,798
3,265
(467)
(14.30)
Available-for-sale
7,903
5,183
2,720
52.48
Held-to-maturity
4,611
8,020
(3,409)
(42.51)
General investments
37
60
(23)
(38.33)
Total
17,073
17,947
(874)
(4.87)
Significant movements in assets, liabilities and funds of the SET group as at December 31, 2015 when compared with the
balance as at December 31, 2014, were as follows:
The SET group maintains a policy to invest in several types of investments such as debt (fixed deposits, government bonds,
corporate debentures) and other instruments through mutual funds. In 2015, the SET group reduced the investment proportion
of held-to-maturity and increased that of available-for-sale securities by investing in global equity funds in order to enhance
returns in the long run.
2. Analysis of financial position
2.1 Analysis of assets
As at December 31, 2015, total assets of the SET group
amounted to THB 36,136 million, an increase of THB 1,684
million, or 4.89%, in comparison with the balance as at
December 31, 2014. Details are as follows:
2.1.1 Cash and cash equivalents, cash at banks for
financial benefits payable and investments
were THB
17,073 million or 47.24% of total assets, dropped by THB 874
million, or 4.87% as follows: