


 124 / 196

Annual Report 2014
124
3,082
2,976 106
3.56
1,260
1,240 20
1.61
470
517 (47)
(9.09)
271
238 33
13.87
208
189
19
10.05
192
157
35
22.29
186
157
29
18.47
143
136
7
5.15
63
60
3
5.00
289
282
7
2.48
871
821 50
6.09
423
460 (37)
(8.04)
442
298 144
48.32
(18)
59 (77)
(130.51)
24
4 20
500.00
1.3
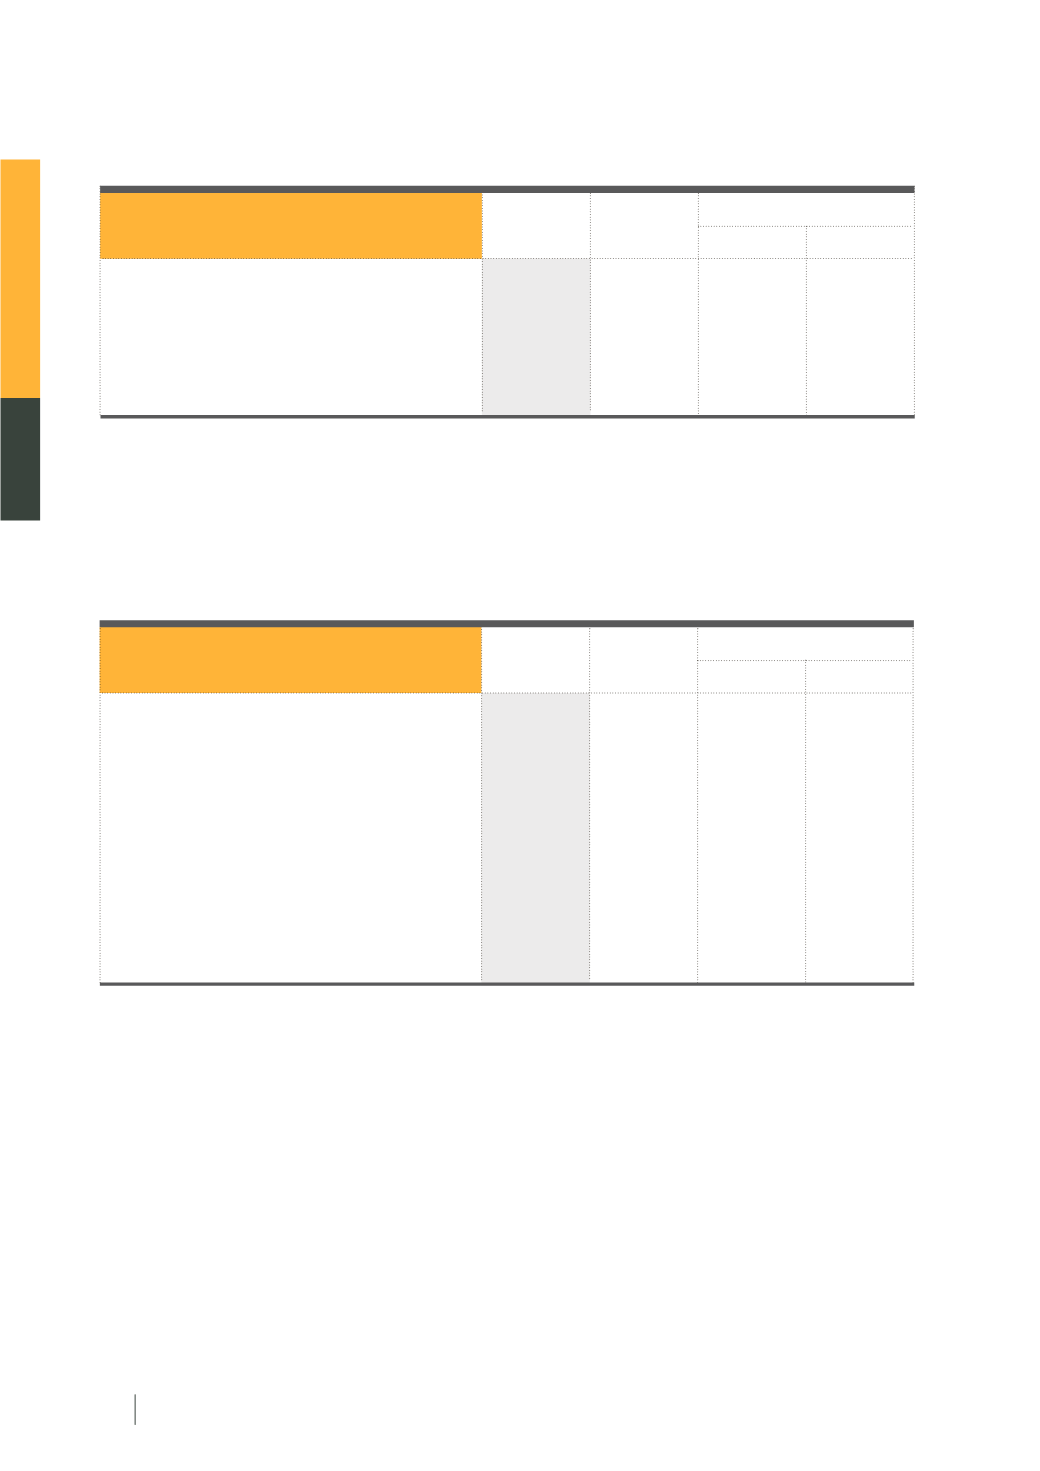
Investment income
1.4
Operating expenses
2014
2013
Increase / (Decrease)
Amount
%
2014
2013
Increase / (Decrease)
Amount
%
Operating expenses
Employee benefit expenses
SEC fees
Direct service expenses
Depreciation and amortization
Educational activities expenses
Technology expenses
Marketing expenses
Fees and compensation expenses
Others
Investment income
Interest income
Dividend income
Realized gain (loss) from investments
Others
Investment income rose by THB 50 million, or 6.09%, in comparison with 2013. This was mainly from the
better return from investment in equity fund.
In 2014, the SET group had operating expenses of THB 3,082 million, increasing 3.56% from 2013. This was
mainly from the increase in employee benefit expenses. Direct service expenses, which are normally linked to the
number of corporate action services, rose. Educational activities expenses which are generally linked to the number of
event, rose. Technology and depreciation expenses increased as new IT system development, i.e., trading system,
clearing system. While the total SEC fees decreased, as linked to the trading value of equity securities.
(Unit: THB million)
(Unit: THB million)