


 120 / 196

Annual Report 2014
120
(Unit: THB million)
4,201
4,309
(108)
(2.51)
165
172
(7)
(4.07)
871
821
50
6.09
(3,082)
(2,976)
106
3.56
(547)
(562)
(15)
(2.67)
(113)
(132)
(19)
(14.39)
1,535
1,661
(126)
(7.59)
Overview
Management discussion
and analysis
1.Analysis of operating results
1.1
Operating revenues
Operating revenues by segment
Operating revenues are classified by segment
as follows: Securities markets, Derivatives markets,
Technology services and Registrar services.
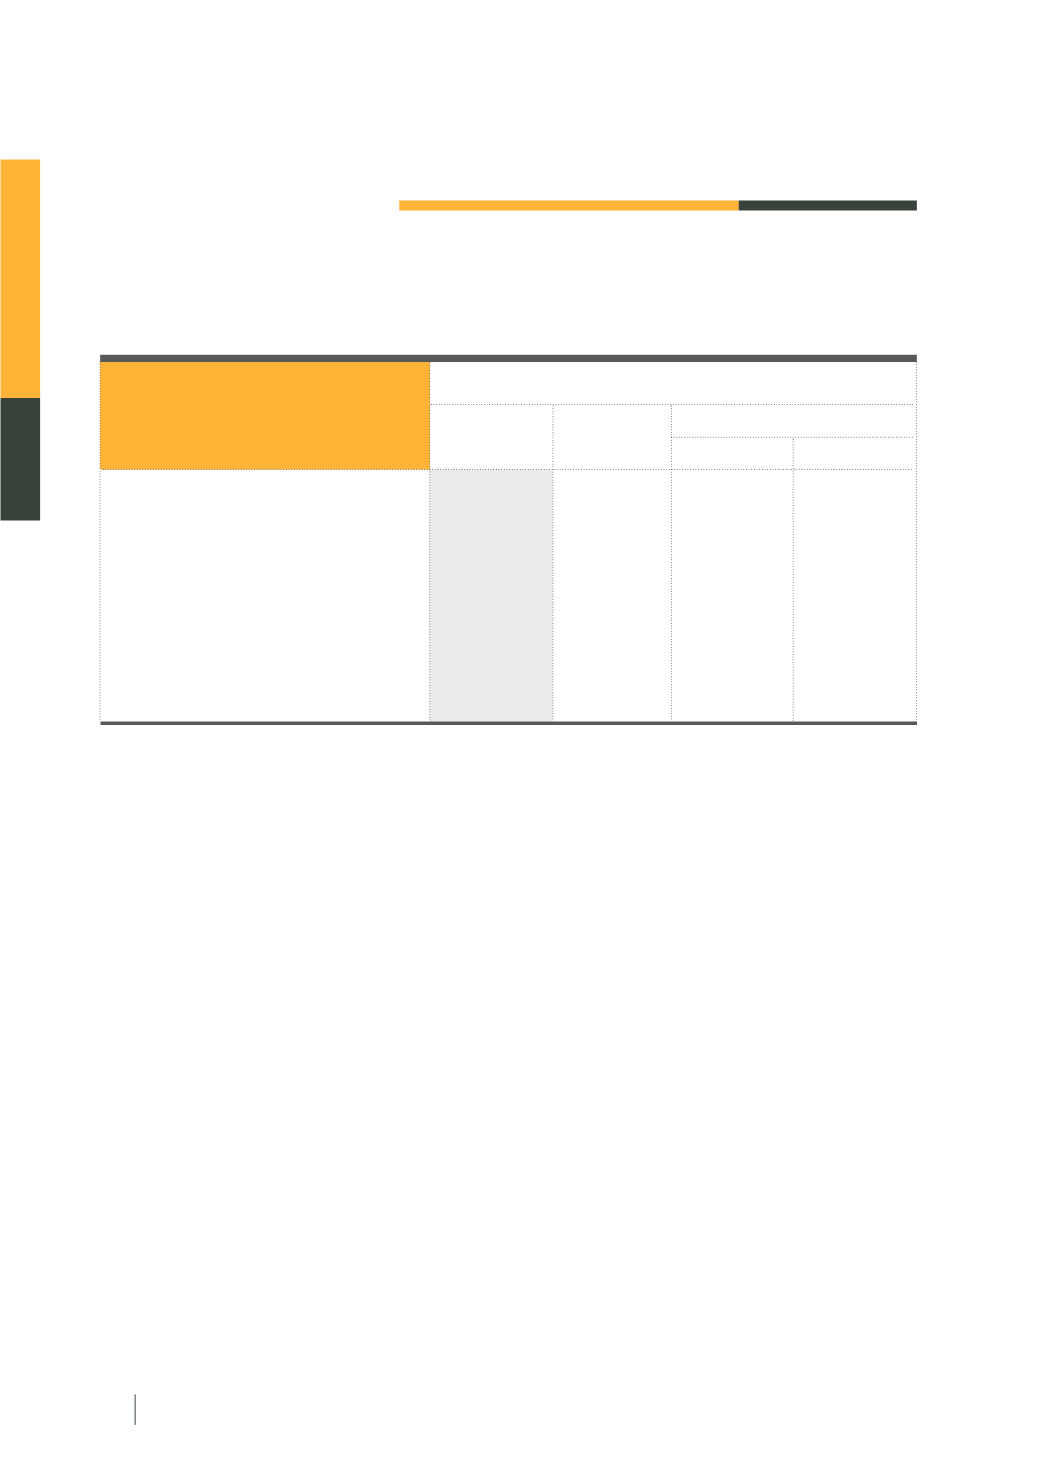
2014
2013
For the year ended December 31
Increase / (Decrease)
Amount
%
Operating revenues
Other income
Investment income
Operating expenses
Contributions to The Stock Exchange
of Thailand Foundation (Foundation)
Income tax expense
Revenues over expenses
Revenues over expenses for the year ended
December 31, 2014 decreased by THB 126 million, or
7.59% in comparison with 2013. Operating revenues
dropped by THB 108 million or 2.51%, mainly due to
daily average trading volume of equity decrease and
revenue from derivatives decrease. Investment income
increased by THB 50 million, or 6.09%, mainly due
to the better return from investment in equity fund.
Operating expenses rose by THB 106 million, or 3.56%,
mainly due to the rise in registrar expenses, linked to
the number of corporate action services transactions.
Technology expenses and depreciation increased from
new IT system development, i.e., new trading system
and clearing system. Contributions to Foundation
decreased by THB 15 million, or 2.67%, as revenues
over expenses decreased, therefore, one-third of that
amount appropriated to Foundation decreased.
The operating results of the SET group for the years ended December 31, 2014 and 2013 were: