


 160 / 196

Annual Report 2014
160
2014
2014
2013
2013
Consolidated
SET
2014
2013
Consolidated
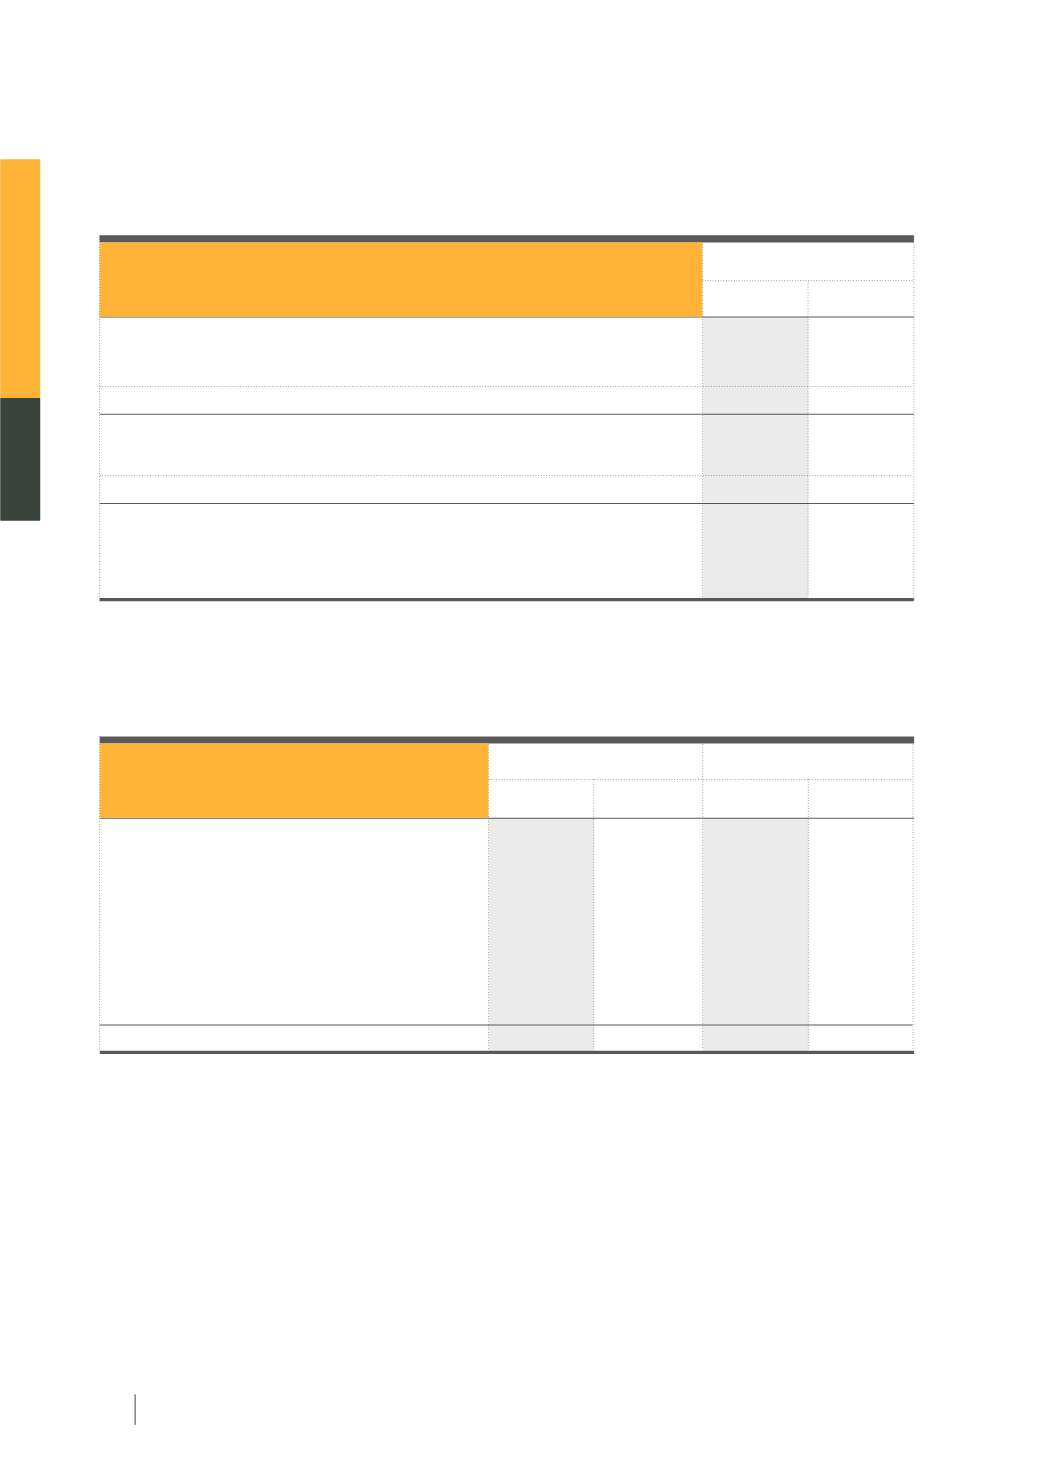
14. Investments in associates, net
The following summary of the financial information in respect of the interest in the jointly-controlled entity
as at 31 December 2014 and 2013 and for the years then ended which has been accounted for using the equity
method represents the Group’s share:
153,755
139,737
49,009
45,594
202,764
185,331
66,704
56,761
9,488
7,683
76,192
64,444
200,136
195,261
191,032
191,085
7,384
3,397
Current assets
Non-current assets
Total assets
Current liabilities
Non-current liabilities
Total liabilities
Total revenues
Total expenses
Total comprehensive income
(Unit: Baht’000)
(Unit: Baht’000)
508,936
497,803
396,605
396,605
379,015
-
379,015
-
20,487
11,076
-
-
(26,396)
57
-
-
882,042 508,936
775,620
396,605
Associates
Opening balance
Additional investment during the year
Share of profit from investments - recognised in
statements of revenues and expenses
Share of profit from investments - recognised in
statements of comprehensive revenues and expenses
Closing balance