


 150 / 196

Annual Report 2014
150
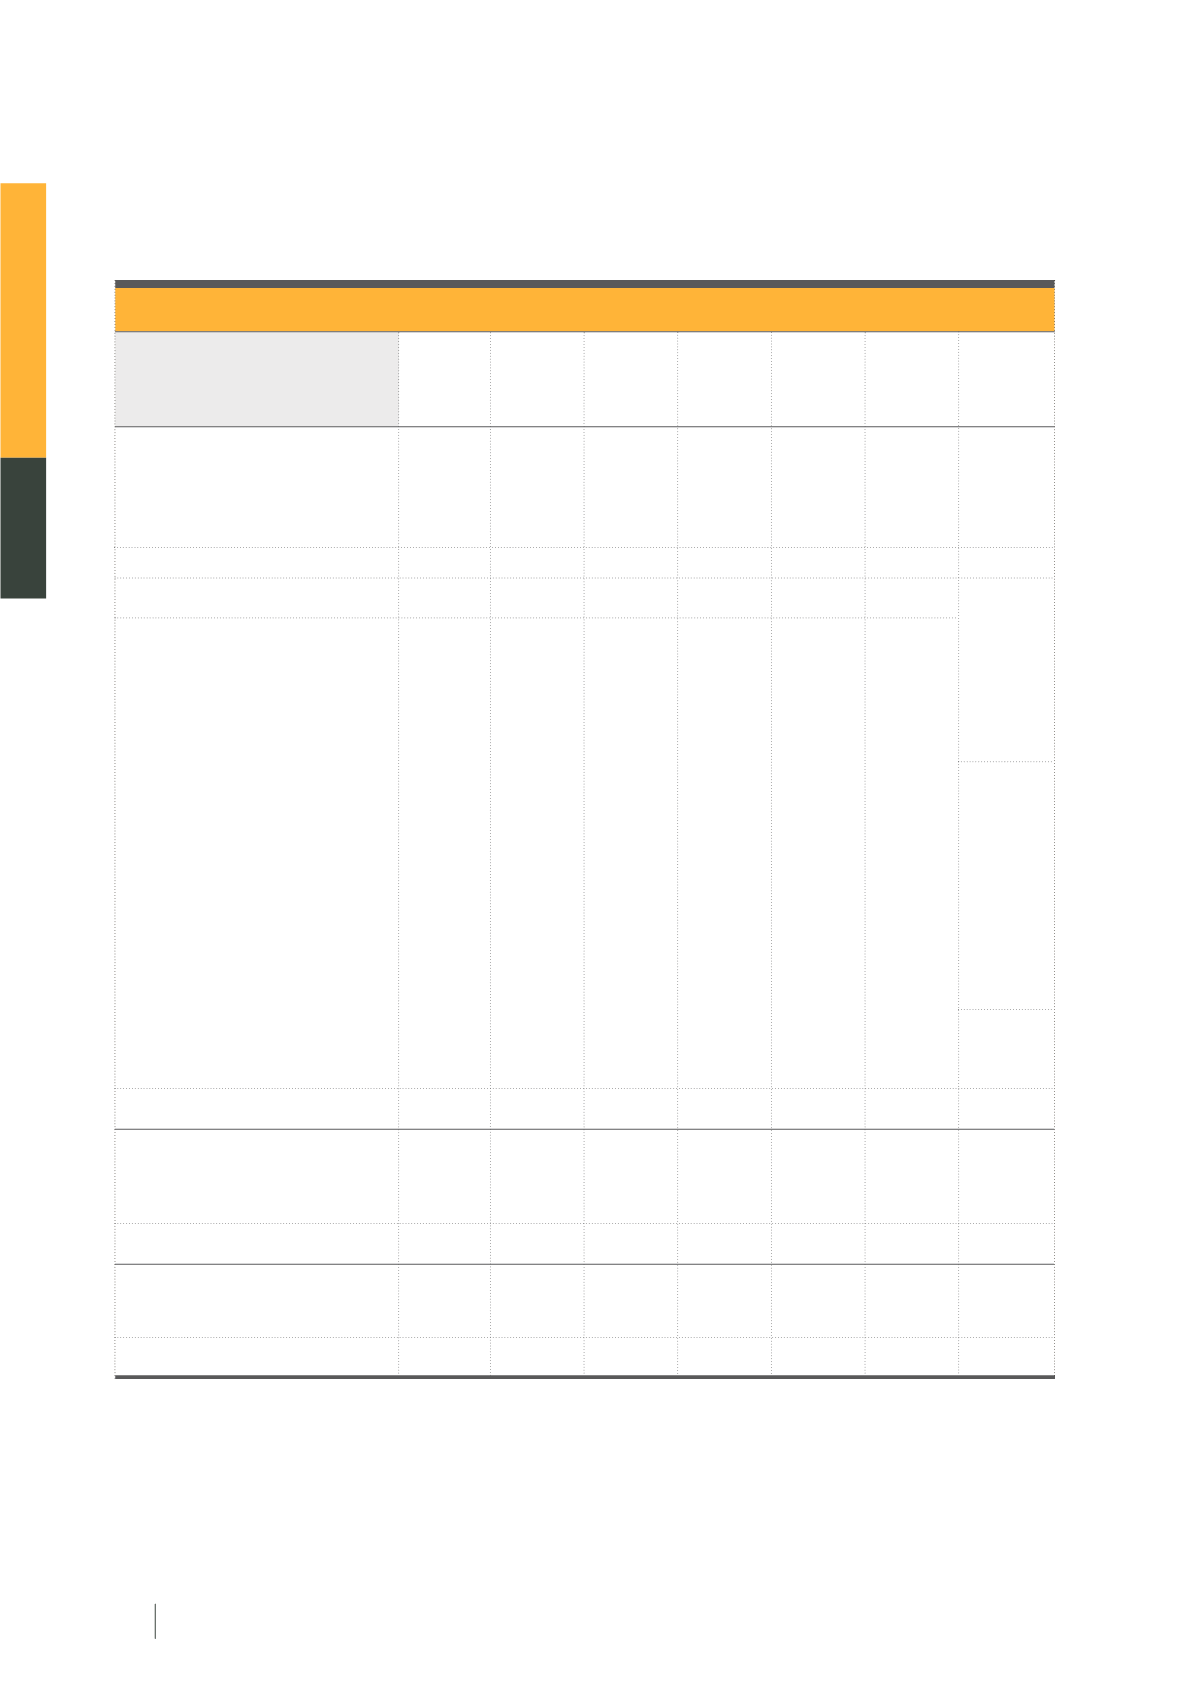
(Unit: Baht’000)
Securities
Markets
Derivatives
Markets
Technology
Services
Registrar
Services
Capital
Market
Development
and others Elimination Total
Consolidated
Investment income, net
Share of profit of investments in jointly-
controlled entity (net of income tax)
Share of profit of investments in
associates (net of income tax)
Revenues over expenses
in operations
Non-operating items:
Income derived from Securities Investor
Protection Fund, net
Income derived from Derivatives Investor
Protection Fund, net
Contributions to the Stock Exchange
of Thailand Foundation
Revenues over expenses before
income tax expenses
Income tax expense
Revenues over expenses
As at 31 December 2013
Segment assets
Other assets
Total assets
Segment liabilities
Other liabilities
Total liabilities
820,730
1,453
11,076
2,338,747
15,125
993
(561,633)
1,793,232
(132,020)
1,076,747 11,216,210 77,326 414,230 866,970 (264,964) 13,386,519
-
-
-
- 1,246,000 (1,246,000)
-
2,515,062 11,610,691 228,887 530,988 692,372 (264,964) 15,313,036
-
-
-
- 20,422,174 (1,695,776) 18,726,398
1,314,043 229,643 72,988 228,441 (339,627)
- 1,505,488
Segment revenues over expenses
2,515,062 11,610,691 228,887 530,988 21,114,546 (1,960,740) 34,039,434
1,076,747 11,216,210 77,326 414,230 2,112,970 (1,510,964) 13,386,519
1,661,212
For the year ended
31 December 2013
Revenues from operation
Revenue from inter-segment
Total revenue
2,440,695 787,838 216,338 835,613 200,523
- 4,481,007
631,969 600,318
35,052 432,526
31,577 (1,731,442)
-
3,072,664 1,388,156 251,390 1,268,139 232,100 (1,731,442) 4,481,007