


 34 / 196

Annual Report 2014
34
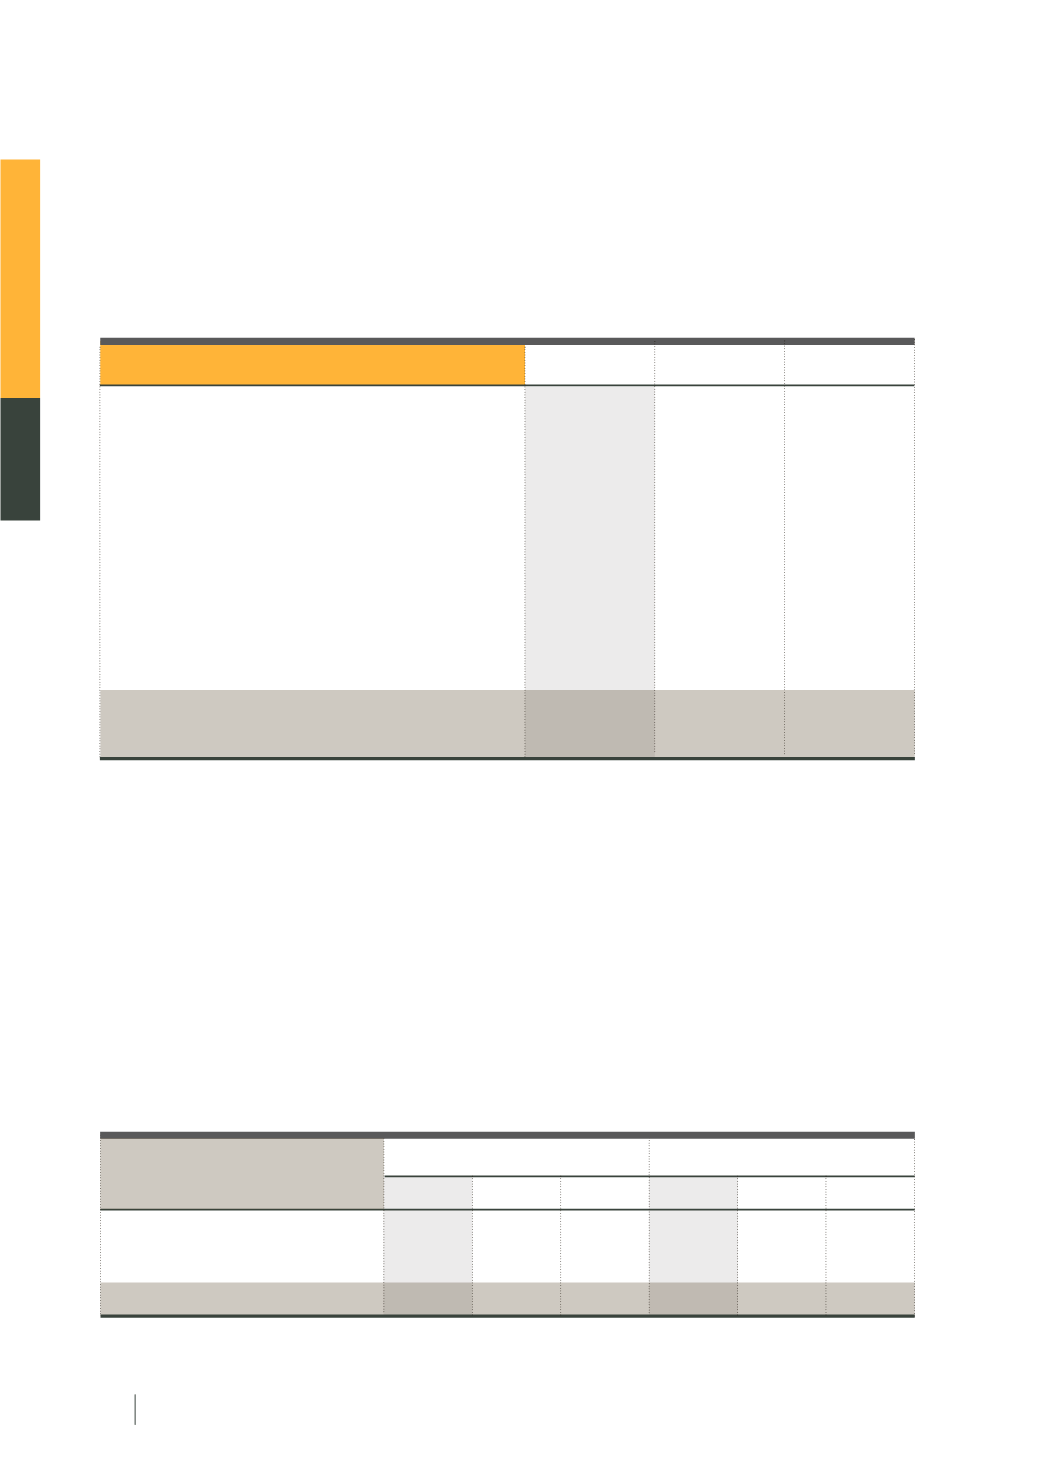
2012
52,467
257,936
310,403
2012
24
133
157
2013
191,600
166,010
357,610
2013
38
178
216
2014
113,990
166,880
280,870
2014
37
159
196
The derivatives market activity also rose favorably.
In 2014, the daily average trading volume surged to
147,026 contracts per day, up by 116.2 percent from 2013. The increase was mainly due to an increase in trading activities
of single stock futures and the modification of SET50 futures contract to a smaller contract size in May 2014. Number
of derivatives trading investors also grew significantly, increased to 100,650 accounts, up by 14.78 percent in 2013.
Daily average trading volume of TFEX (unit: contracts)
Source: SETSMART
Equity capital raising activity was very active in 2014. Initial public offerings (IPOs) continued to be the highest
in the region for two consecutive years.
Equity capital raising in both SET and mai accounted for THB 280.9 billion
(USD 8.5 billion) in 2014, down by 21.46 percent from the previous year. Of which, the initial public offerings
amounted to THB 114.0 billion (USD 3.5 billion), or THB 304.8 billion (USD 9.2 billion) in terms of market
capitalization. This was bolstered by the launch of the Impact Growth Real Estate Investment Trust (IMPACT),
Thailand’s first Real Estate Investment Trust (REIT), of THB 15.7 billion (USD 476 million). Moreover, listed
companies raised funds of about THB 166.9 billion (USD 5.1 billion) in secondary offerings.
Source: SETSMART
Capital raising of SET and mai
*calculated by IPO price multiplied by the number of newly issued equities)
Derivatives Trading
Equity Capital Raising
Initial public offering
Secondary offering
Total
Number of companies
Value* (unit: THB million)
Products
SET 50 Index Futures
SET 50 Index Options
Single Stocks Futures
50 Baht Gold Futures
10 Baht Gold Futures
Oil Futures
Silver Futures
Interest Rate Futures
USD Futures
Sector Index Futures
Total
Trading volume growth (y-o-y)
2012
16,467
221
8,849
4,267
10,601
603
60
0
2,751
4
43,823
6.51
2014
58,790
444
80,100
974
5,319
133
0
0
1,265
0
147,026
116.20
2013
23,218
267
34,351
2,253
6,757
190
5
0
977
0
68,017
55.21